Tag History and Trending
You can view the tag history from various screens:
- View historical trends for groups of tags at a site by tapping the
 Site History icon in the site menu. By default this shows the tags in the first card on the Site Details screen.
 - View individual tag historical trends by tapping the
 Tag History icon on the Site Summary screen.
 - View the tag history for an alarmed tag by choosing Tag History from the alarm menu
- Share the trend by tapping the
 Share icon to send a link to the trend with your configuration settings.
Scroll down or rotate the screen if necessary to seem more of the trends.
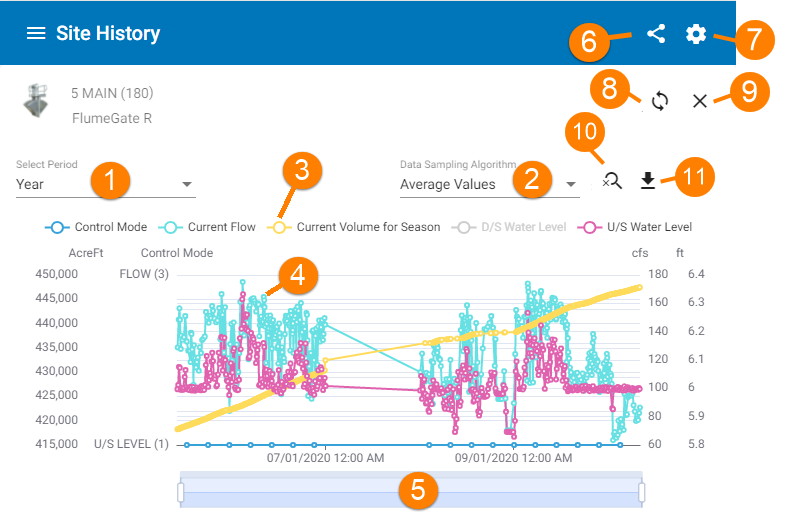
- Select a time interval
- Select a data type
- Tap an item in the legend to show or hide a trend line (this will also hide the axes for that trend line)
- Tap on a data point to view the value at that point.
- Use the navigation bar to zoom or pan around the chart.
- Share the trend with your settings by sending a link
- Configure the tags and y-axes
- Refresh the chart data
- Close the chart screen
- Reset the chart view to the defaults
- Download the chart data
Tag history screen for a group of tags
Navigating the trend chart
Use the navigation bar at the bottom of the chart to zoom in or pan around the graph. Use the handles at each end of the bar to zoom in and slide the bar from side to side to pan.
Choosing a time period
Use the drop-down field to choose a time period:
Note
If there is no data available for the whole of the period you choose, only the period that has data available will be displayed.
- The default time period is the last twelve hours.
- Select Custom to enter a custom time period.
Choosing a data type
Use the Data Sampling Algorithm drop-down to choose how to select the data points for the trend line. Choosing a downsizing option may result in better performance where there is a lot of data available.
The options are:
-
None - show all the available data
-
Minimum values - a downsizing algorithm that selects the minimum value from a set of filtered points.
-
Average values - a downsizing algorithm that selects the average value from a set of filtered points.
-
Maximum values - a downsizing algorithm that selects the maximum value from a set of filtered points.
-
LTTB (Steinarsson) - a downsizing algorithm that reduces the number of data points displayed while retaining the shape of the original trend line.
Viewing Data Points
Note
If there are several trend lines displayed, they will NOT use the same vertical scale.
The vertical scale for each trend line is adjusted to show the full range of data available for that tag and the chosen time period. Take care when comparing different trend lines.
Tap on a data point to view the time and value of the tag at that point.
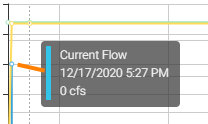
Tap a data point to show the value at that point
Resetting the graph
To reset the graph to the default settings, tap the ![]() Reset icon. This will set the included tags back to the default.
Reset icon. This will set the included tags back to the default.
Exporting and sharing the trend data
-
Export and download the chart data to a csv file by tapping the
 Download icon. This will download all the chart data including hidden tags and tags that you have added to the chart.
 -
Send a link to the chart by tapping the
 Share icon in the top right of the page. The link will include your configuration settings.
Configuring the Tags and Axes in the Settings Panel
Tap ![]() Settings to open the Settings panel. Use this tool to do the following:
Settings to open the Settings panel. Use this tool to do the following:
The settings menu has two tabs:
-
Y Axis - for configuring the tag vertical axes.
-
Tags - for configuring tag display settings and adding new tags to the chart
Add a new tag to the chart
To add a new tag to the chart:
-
On the Tags tab of the Settings panel tap the
 Add button at the bottom of the screen to add a new tag.
 -
Choose a tag (or tags) from the drop-down list of site tags. The new tag will remain on the chart until it is closed.
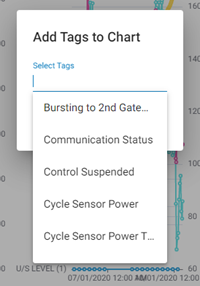
Select tags to add to the chart
Showing or hiding tag trend lines
To configure the visibility of tag trend lines:
-
On the Tags tab of the Settings panel, select the tag that you want to configure.
-
Use the Show/Hide toggle to set the tag visibility.
-
Tap Save to save your settings.
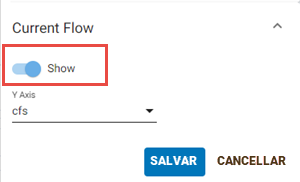
Show or hide a tag
Note
To reset the visibility of all trend lines to the default settings tap the ![]() Reset icon.
Reset icon.
Configuring vertical axes
Use the Y Axis tab of the Settings panel to configure the vertical axes for the tag trend lines.
By default, the chart will show a vertical axis for each unit of measurement used by the tags on the chart and the range of the axes will cover the range of values found in the tag(s) using that unit.
Example
For example, if you have the following tags on your chart:
-
Current Flow in m/s
-
Upstream level in m
-
Downstream level in m
Then by default you will have two vertical axes:
-
m/s (used by the current flow tag)
-
m (used by the two water level tags)
Changing the Y axis settings
To change the Y-axis settings
-
On the Y Axis tab of the Settings menu select the axis that you want to configure.
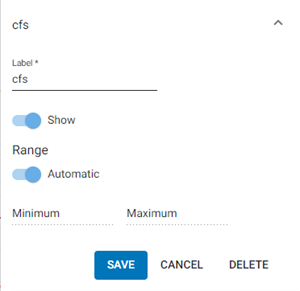
key
Configuring the 'cfs' axis
-
Edit the label field if you want to change the axis label
-
Use the Show/Hide toggle to show or hide the axis
-
Set the way that the axis range is determined:
-
Leave the range set to Automatic to automatically adjust to the range of values currently stored for the tags using this axis.
-
Turn off the Automatic setting to set the range manually, Then enter the minimum and maximum values for the axis
Example
For example, you might do this if :
-
You want to ensure that the axis starts at zero.
-
You want to restrict your axis range to concentrate on common values and ignore outliers
-
-
Add a new Y Axis
You can add a new Y axis to the chart and configure a tag to use that axis.
Example
You might do this if you have two tags using the same axis (such as upstream and downstream water level tags) and you want to use separate axes for each tag.
To add a new Y-axis
-
On the Y Axis tab of the Settings panel tap the
 Add button at the bottom of the screen to add a new Y axis.
 -
Give the axis a label. Leave the range and visibility settings at the defaults for now and click Save to save your settings.
-
On the Tags tab, select the tag that you want to use this axis and select the new axis in the Y Axis drop-down. Click Save to save your settings.
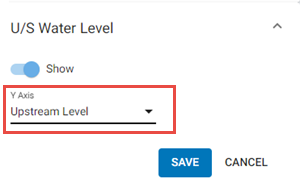
Changing the tag axis
You can now go back and configure the axis visibility and range settings if necessary on the Y Axis tab.
Note
You don't assign units to an axis. The axis just uses the range of values assigned to the tag (or specified by you) regardless of units. Take care not to use the axis for tags that are measured in different units.
Deleting an axis
To delete an axis
-
On the Tags tab of the Settings menu, check to see if any tags are associated with the axis and remove the associations. You cannot delete an axis that is being used by a tag.
-
On the Y Axis tab of the Settings menu select the axis that you want to delete and tap the Delete button.