Create a Calculated Trend
You can add a trend line that shows values calculated from another selected trend line. The calculated trend can be exported in the same way as real trend lines.
There are two types of calculated line available:
- Interval Sampling - plot the value of the source trend line at specified intervals. This allows you to filter noisy trend data.
- Average - plot the average value of the source trend calculated for the source trend period.
More options may be available in future versions.
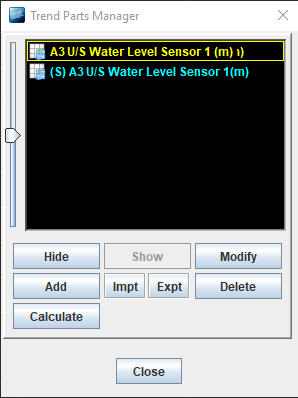
The calculated trend uses the same horizontal and vertical scale as the source trend. By default, the name of the calculated trend is the same as that of the original trend but with an (S) prefix, but you can change the name if you prefer.
To create a calculated trend:
- In the Trend tool, click
 Trend Detail to open the Trend parts manager.
 - Select the trend to use as the source of the calculation.
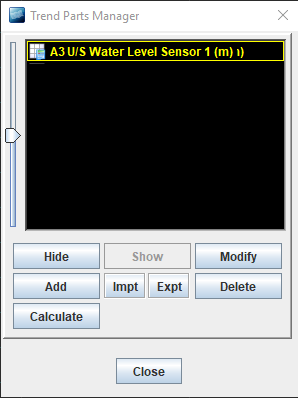
- Click Calculate.
- In the Calculated Trend screen, choose either Interval Sampling or Average. If you choose Interval Sampling, enter the following details:
Field Description Time interval Enter the calculation interval. This is the interval at which the snapshot values will be picked. Start Time Enter the start time for the calculated trend. This will default to the same start time as the source trend. 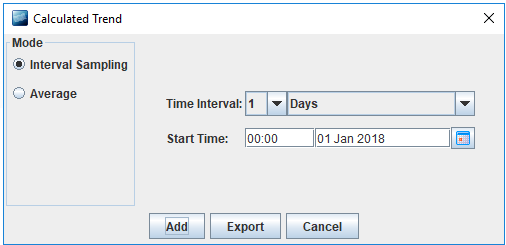
- Click Add to save your changes and Close the Trend Parts Manager to view your calculated trend.