Communications Monitor
The Comms Monitor is used as a troubleshooting tool to analyse communications with sites. Use the Comms Monitor when there are communication issues in your network, or when you need to confirm that there has been no interruption to communications.
Comms Events Table
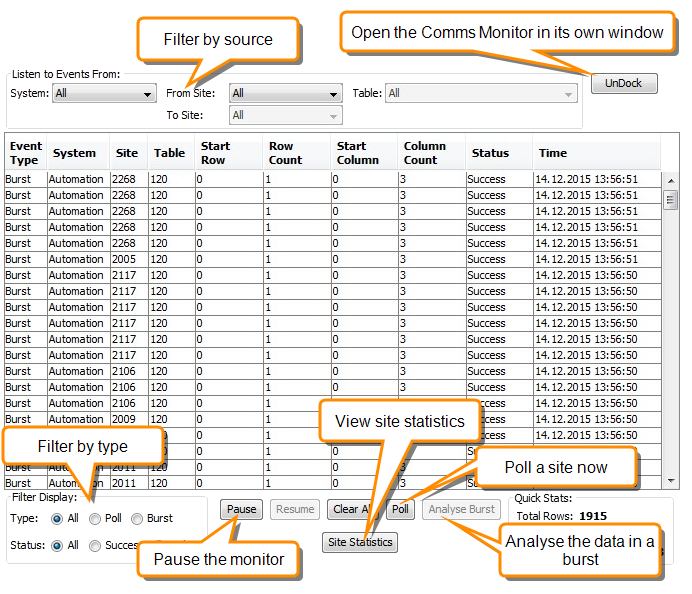
View communication events on the Events table. Communication with sites is of two types:
- Poll - communications that is initiated by the host system. Regular polling is configured for the site tables or you can initiate a poll from the Comms Monitor.
- Burst - communications that is initiated by the site, usually in response to exceeding a threshold value such as an alarm setting.

Filtering the Events in the Comms Monitor
Filter the Comms Monitor display to restrict the events displayed. You can filter by source, and by type of communication.
| Note: |
Filtering by source controls what data is recorded in the event table. Filtering by type or by request status simply shows or hides the recorded data using the type and status filter settings. |
|---|
Filtering by source
The controls at the top of the Events table allow you to filter the communications by System, Site and Table. Any events that do not match the filter are not displayed in the table.
To choose a range of sites, specify the From Site and To Site settings. Sites are listed in alphabetical order.
| Note: |
When Rubicon configures sites for a network, site names are prefixed with a number such that the site name is closely related to its network location. This means that selecting a range of sites by name selects a geographically meaningful group of sites. If this is not true for your network, selecting a range of sites may not be useful. |
|---|
Filtering by type
The Filter Display controls at the bottom left of the Events table allow you to filter by communication type and status. Filter by type by choosing to display All events, Poll events or Burst events
If you have included poll events, you can filter by status by choosing to display either All requests, Successful requests or Failed requests. Burst data is not requested by the host, so it is not useful to filter these events by request status.
Pausing and resuming the monitor
There may be a large number of events added to the Events table. It is sometimes useful to pause the comms monitor to view the details of an event.
To pause or resume monitoring click the Pause or Resume buttons below the Events table. While monitoring is paused, no more events are displayed on the table although they are still communicated in the background.
Analysing a Burst
To analyse the contents of a burst event:
- In the Events table, highlight the Burst row that you want to analyse.
Note: You can freeze the table by clicking the Pause button. Press the Resume button to continue showing new events.
- Click the Analyse Burst button to open the Analyse window. this shows the tag values within the burst data.
You can also analyse a burst event from the Communications Statistics window.
Polling a Site
You can use the Comms Monitor to initiate a one-off poll of a specific site and table.
To poll with the Comms Monitor:
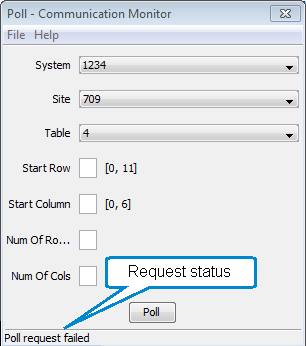
- Click the Poll button under the Events table to open the Poll Communication Monitor.
- Specify the System, Site, and Table that you want to poll.
Note: You can also select a row, then click the Poll button to poll that row. - (Optional)Specify the rows and columns that you want to poll. To do this, specify the start column and row and the number of columns and rows to poll. If you leave these values blank, the whole table is polled.
Click the Poll button. The host attempts to poll the table. The status bar at the bottom of the Poll Communication Monitor indicates whether the request succeeded or failed.

Viewing Communication Statistics
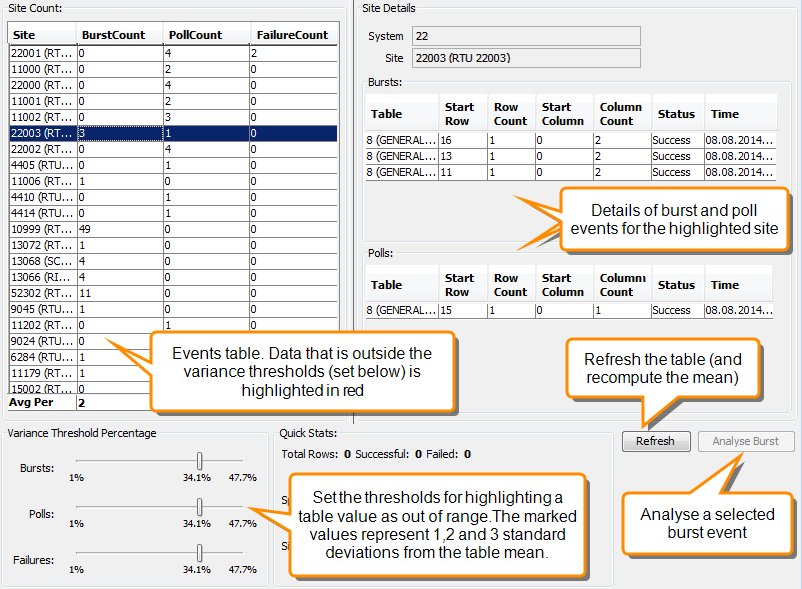
View a summary of events for all sites and details for a selected site in the site statistics.
To view site statistics:
In the Comms Monitor, click the Site Statistics button to open the Communication Monitor Statistics window.
