History
- View important site historical trends (flow and water levels) on the Site Details screen > History tab.
- View individual tag historical trends by tapping
 History on the Tag Details screen.
Scroll down if necessary to seem more of the trends.
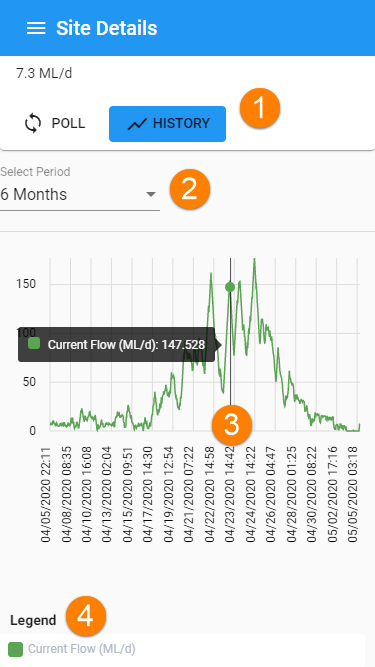
- Tap the History icon to view the trend
- Select a time interval
- Tap on the trend graph to view the value at a point
- The legend shows which tags are trended.
Tag history screen (scrolled down to see the legend)
Choosing a time period
Use the drop-down field to choose a time period:
- The default time period is the last twelve hours.
- Select Custom to enter a custom time period.
Viewing Data Points
Note
If there are several trend lines displayed, they will NOT use the same vertical scale.
The vertical scale for each trend line is adjusted to show the full range of data available for that tag and the chosen time period. Take care when comparing different trend lines.
Tap on a data point to view the time and value of the tag at that point.