Tag History and Trending
You can view the tag history from various screens:
- View historical trends for groups of tags at a site by tapping the
 Site History icon in the site menu.
 - View individual tag historical trends by tapping the
 Tag History icon on the Tag Details screen.
 - View the tag history for an alarmed tag by choosing Tag History from the alarm menu
Scroll down or rotate the screen if necessary to seem more of the trends.
- Select a time interval
- Select a data type
- Tap an item in the legend to show or hide a trend line (this will also hide the axes for that trend line)
- Tap on a data point to view the value at that point.
- Use the navigation bar to zoom or pan around the chart.
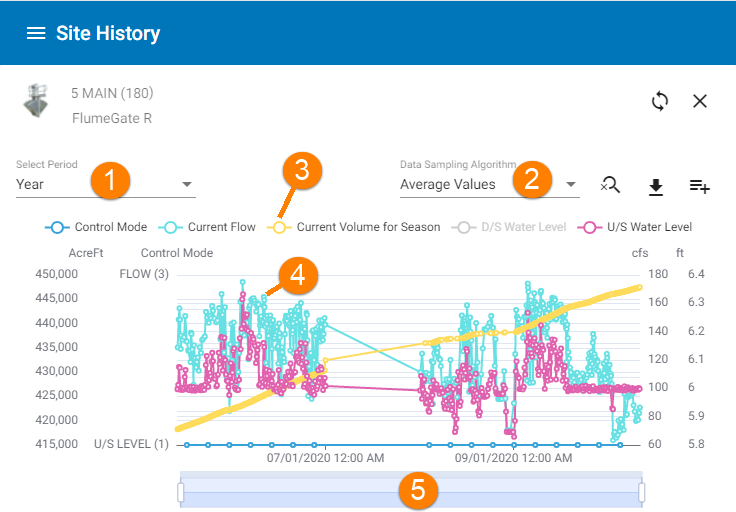
Tag history screen for a group of tags
Navigating the trend chart
Use the navigation bar at the bottom of the chart to zoom in or pan around the graph. Use the handles at each end of the bar to zoom in and slide the bar from side to side to pan.
Vertical Axes
Note that each trend line may have its own vertical axis and that the vertical axis will not always start at zero. The scale is adjusted to optimise the visibility of the available data.
Choosing a time period
Use the drop-down field to choose a time period:
Note
If there is no data available for the whole of the period you choose, only the period that has data available will be displayed.
- The default time period is the last twelve hours.
- Select Custom to enter a custom time period.
Choosing a data type
Use the Data Sampling Algorithm drop-down to choose how to select the data points for the trend line. Choosing a downsizing option may result in better performance where there is a lot of data available.
The options are:
-
None - show all the available data
-
Minimum values - a downsizing algorithm that selects the minimum value from a set of filtered points.
-
Average values - a downsizing algorithm that selects the average value from a set of filtered points.
-
Maximum values - a downsizing algorithm that selects the maximum value from a set of filtered points.
-
LTTB (Steinarsson) - a downsizing algorithm that reduces the number of data points displayed while retaining the shape of the original trend line.
Viewing Data Points
Note
If there are several trend lines displayed, they will NOT use the same vertical scale.
The vertical scale for each trend line is adjusted to show the full range of data available for that tag and the chosen time period. Take care when comparing different trend lines.
Tap on a data point to view the time and value of the tag at that point.
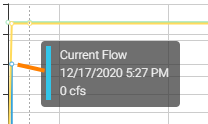
Tap a data point to show the value at that point
Adding a new tag to the graph
To add a new trend line to a chart:
-
Tap the
 Add tags to chart icon.
 -
Choose a tag (or tags) from the drop-down list of site tags. The new tag will remain on the chart until it is closed.
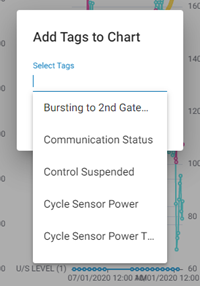
Select tags to add to the chart
Showing or hiding trend lines
You can toggle the visibility of individual trend lines and their axes by tapping the icon for that trend line in the key at the top of the chart. To reset the visibility of all trend lines to the default settings tap the ![]() Reset icon.
Reset icon.
Exporting the trend data
Export and download the chart data to a csv file by tapping the ![]() Download icon. This will download all the chart data including hidden tags and tags that you have added to the chart.
Download icon. This will download all the chart data including hidden tags and tags that you have added to the chart.