Viewing Data on a Trend Line
You can view the values of trended data at any point on the charted timeline by clicking and moving your mouse pointer along the chart. Data for each point is displayed on the chart as shown here.
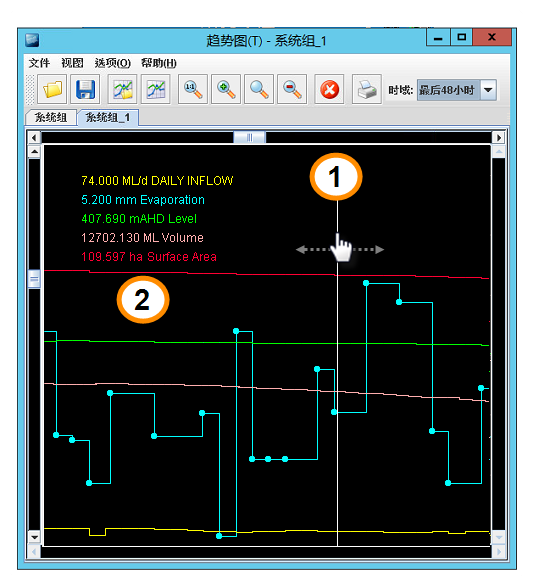
Trend data: Move the sliding bar (1) to view the values at that point (2)
The information displayed on the graph, and where it is displayed, can be configured in the Trend Group Manager in the Marker Style properties for the group. See Creating a Trend Group for details