Using the Flow Histogram
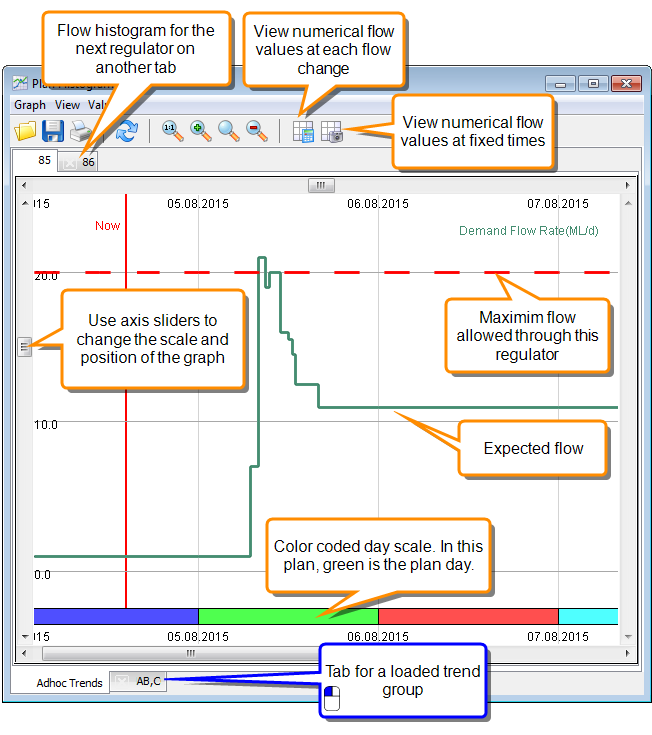
Use the flow histogram to view a graph of flows through any outlet or regulator. For example, open the flow histogram for the linking regulator and keep it open while you link flows or make changes to orders. The flow histogram is a quick way to confirm that you have maintained the flow below the maximum for the regulator, and shows how smooth the changes are for the regulator.
To open a flow histogram, right click on the outlet or regulator and choose Histogram from the shortcut menu. You can open more than one histogram at a time and display them in separate tabs.
Note
Opening too many histograms may affect system performance. If you don't want to lose your current set of histograms, you can save them as a Trend Group and re-open them later. See Creating and Loading a Trend Group for details.

This histogram shows the flow through a linking regulator with flows on the plan day due to orders, and downstream demand at a setflow. The current demand exceeds the maximum flow through the regulator, so we should link and modify orders to spread the demand through the day.